Data as vectors, using R the function c()
> age <- c(1,3,5,2,11,9,3,9,12,3)> weight <- c(4.4,5.3,7.2,5.2,8.5,7.3,6.0,10.4,10.2,6.1)
> age <- c(1,3,5,2,11,9,3,9,12,3)
> mean(weight)
[1] 7.06
> sd(weight)
[1] 2.077498
> cor(age,weight)
[1] 0.9075655
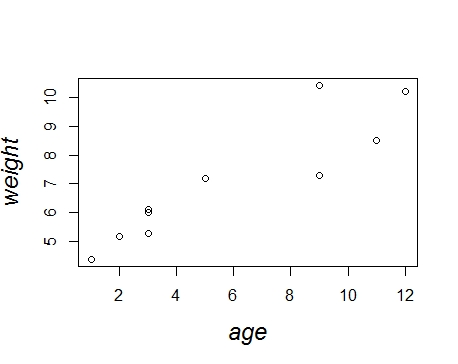
> plot(age,weight)
> q()
You can see from listing that the mean weight for these 10 infants is 7.06 kilograms, that the standard deviation is 2.08 kilograms, and that there is a strong linear relationship between age in months and weight in kilograms (correlation = 0.91). The relationship can also be seen in the scatter plot in figure Not surprisingly, as infants get older, they tend to weigh more. The scatter plot in the figure is informative but somewhat utilitarian and unattractive.


0 Comments