R functions work on bigger data
R functions work on bigger data structures like vectors and matrices by default
> x <- seq(0, 10, 0.1)
> y <- sin(x)
> plot(x, y)
> plot(x,y^2)
> plot(x,y^3)
> plot(x, y, type = "l")
R functions work on bigger data structures like vectors
> y1 <- cos(x)
> lines(x, y1, col = "red")
> x1 <- 1:10
> text(x1, sin(x1), x1, col = "green")
>
> plot(x, y, xlim = c(-10, 10), ylim = c(-2, 2),
+ xlab = "x-Values", ylab = "y-Values", main = "Example Graphics")
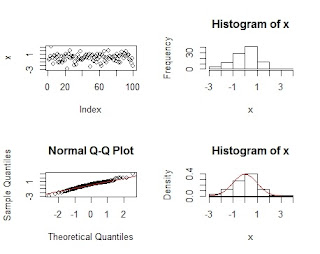
> par(mfrow = c(2, 2))
> x <- rnorm(100)
> plot(x)
> hist(x)
>
> qqnorm(x)
> qqline(x, col="red")
> hist(x, probability = TRUE)
>
> xx <- seq(-3, 3, 0.1)
> lines(xx, dnorm(xx, 0, 1),col = "red")
>
> x <- rnorm(100)
> shapiro.test(x)
Shapiro-Wilk normality test
data: x
W = 0.98229, p-value = 0.1998
>
> par(mfrow=c(2,2))
>
> y <- runif(100)
> plot(y)
> hist(y)
>
> qqnorm(y)
>
> qqline(y, col="red")
> mean(y)
[1] 0.5052021
> var(y)
[1] 0.06479489
> min(y)
[1] 0.007599009
> max(y)
[1] 0.9939666
> hist(y, probability=TRUE)
>
> yy <- seq(min(y), max(y), length = 50)
> lines(yy, dnorm(yy, mean(y), sd(y)), col = "red")
> shapiro.test(y)
Shapiro-Wilk normality test
data: y
W = 0.96773, p-value = 0.01486
> par(mfrow=c(1, 1))
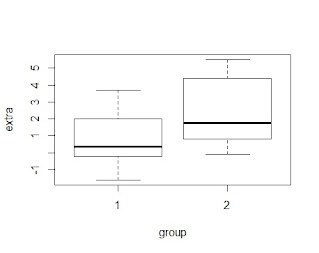
> boxplot(x, y)
> x <- c(2, 4, 6, 5, 8)
> f <- as.factor(x)
> as.numeric(f)
[1] 1 2 4 3 5
> attributes(f)
$`levels`
[1] "2" "4" "5" "6" "8"
$class
[1] "factor"
> attr(f, "class")
[1] "factor"
> class(f)
[1] "factor"
> x <- c(1, 2, 5, 7, 3, 4, 5, 8)
> dat <- data.frame(f = c("a", "a", "a", "b", "b", "b"),
+ x = c(1, 4, 3, 3, 5, 7)
+ )
> colMeans(dat[2:8])
Error in `[.data.frame`(dat, 2:8) : undefined columns selected
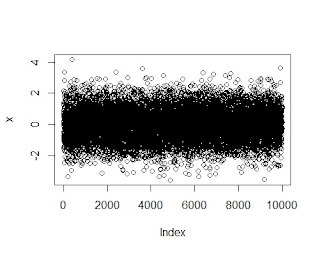
> system.time({
+ x <- rnorm(10000)
+ plot(x)
+ })
user system elapsed
0.06 0.27 0.35


1 Comments
Choose 'what's the reason': The researcher of extraction of information ought to do inside and out investigation of your organization for which he is procured. machine learning course in pune
ReplyDelete