How to solve data with the decision tree model?
To package we can use use in R language.
> library("tree", lib.loc="~/R/win-library/3.6")
package ‘tree’ was built under R version 3.6.3
> library("rpart", lib.loc="C:/Program Files/R/R-3.6.1/library")
> z.auto <- rpart(Mileage ~ Weight, car.test.frame)
> summary(z.auto)
Call:
rpart(formula = Mileage ~ Weight, data = car.test.frame)
n= 60
CP nsplit rel error xerror
1 0.59534912 0 1.0000000 1.0357444
2 0.13452819 1 0.4046509 0.6025554
3 0.01282843 2 0.2701227 0.4616261
4 0.01000000 3 0.2572943 0.4506753
xstd
1 0.17909954
2 0.10567035
3 0.08353329
4 0.07617290
Variable importance
Weight
100
Node number 1: 60 observations, complexity param=0.5953491
mean=24.58333, MSE=22.57639
left son=2 (45 obs) right son=3 (15 obs)
Primary splits:
Weight < 2567.5 to the right, improve=0.5953491, (0 missing)
Node number 2: 45 observations, complexity param=0.1345282
mean=22.46667, MSE=8.026667
left son=4 (22 obs) right son=5 (23 obs)
Primary splits:
Weight < 3087.5 to the right, improve=0.5045118, (0 missing)
Node number 3: 15 observations
mean=30.93333, MSE=12.46222
Node number 4: 22 observations
mean=20.40909, MSE=2.78719
Node number 5: 23 observations, complexity param=0.01282843
mean=24.43478, MSE=5.115312
left son=10 (15 obs) right son=11 (8 obs)
Primary splits:
Weight < 2747.5 to the right, improve=0.1476996, (0 missing)
Node number 10: 15 observations
mean=23.8, MSE=4.026667
Node number 11: 8 observations
mean=25.625, MSE=4.984375
> head(car.test.frame)
Price Country
Eagle Summit 4 8895 USA
Ford Escort 4 7402 USA
Ford Festiva 4 6319 Korea
Honda Civic 4 6635 Japan/USA
Mazda Protege 4 6599 Japan
Mercury Tracer 4 8672 Mexico
Reliability Mileage Type
Eagle Summit 4 4 33 Small
Ford Escort 4 2 33 Small
Ford Festiva 4 4 37 Small
Honda Civic 4 5 32 Small
Mazda Protege 4 5 32 Small
Mercury Tracer 4 4 26 Small
Weight Disp. HP
Eagle Summit 4 2560 97 113
Ford Escort 4 2345 114 90
Ford Festiva 4 1845 81 63
Honda Civic 4 2260 91 92
Mazda Protege 4 2440 113 103
Mercury Tracer 4 2285 97 82
> data(car90)
> head(car90)
Country Disp Disp2 Eng.Rev
Acura Integra Japan 112 1.8 2935
Acura Legend Japan 163 2.7 2505
Audi 100 Germany 141 2.3 2775
Audi 80 Germany 121 2.0 2835
BMW 325i Germany 152 2.5 2625
BMW 535i Germany 209 3.5 2285
Front.Hd Frt.Leg.Room
Acura Integra 3.5 41.5
Acura Legend 2.0 41.5
Audi 100 2.5 41.5
Audi 80 4.0 42.0
BMW 325i 2.0 42.0
BMW 535i 3.0 42.0
Frt.Shld Gear.Ratio Gear2 HP
Acura Integra 53.0 3.26 3.21 130
Acura Legend 55.5 2.95 3.02 160
Audi 100 56.5 3.27 3.25 130
Audi 80 52.5 3.25 3.25 108
BMW 325i 52.0 3.02 2.99 168
BMW 535i 54.5 2.80 2.85 208
HP.revs Height Length Luggage
Acura Integra 6000 47.5 177 16
Acura Legend 5900 50.0 191 14
Audi 100 5500 51.5 193 17
Audi 80 5300 50.5 176 10
BMW 325i 5800 49.5 175 12
BMW 535i 5700 51.0 186 12
Mileage Model2 Price Rear.Hd
Acura Integra NA 11950 1.5
Acura Legend 20 24760 2.0
Audi 100 NA 26900 3.0
Audi 80 27 18900 1.0
BMW 325i NA 24650 1.0
BMW 535i NA 33200 2.5
Rear.Seating RearShld
Acura Integra 26.5 52.0
Acura Legend 28.5 55.5
Audi 100 31.0 55.0
Audi 80 28.0 52.0
BMW 325i 25.5 51.5
BMW 535i 27.0 55.5
Reliability Rim Sratio.m
Acura Integra Much better R14 NA
Acura Legend Much better R15 NA
Audi 100 <NA> R15 NA
Audi 80 <NA> R14 NA
BMW 325i better R14 NA
BMW 535i <NA> R15 NA
Sratio.p Steering Tank Tires
Acura Integra 0.86 power 13.2 195/60
Acura Legend 0.96 power 18.0 205/60
Audi 100 0.97 power 21.1 205/60
Audi 80 0.71 power 15.9 175/70
BMW 325i 0.88 power 16.4 195/65
BMW 535i 0.78 power 21.1 225/60
Trans1 Trans2 Turning Type
Acura Integra man.5 auto.4 37 Small
Acura Legend man.5 auto.4 42 Medium
Audi 100 man.5 auto.3 39 Medium
Audi 80 man.5 auto.3 35 Compact
BMW 325i man.5 auto.4 35 Compact
BMW 535i man.5 auto.4 39 Medium
Weight Wheel.base Width
Acura Integra 2700 102 67
Acura Legend 3265 109 69
Audi 100 2935 106 71
Audi 80 2670 100 67
BMW 325i 2895 101 65
BMW 535i 3640 109 69
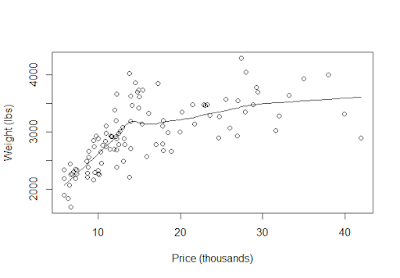
> plot(car90$Price/1000, car90$Weight,
+ xlab = "Price (thousands)", ylab = "Weight (lbs)")
> mlowess <- function(x, y, ...) {
+ keep <- !(is.na(x) | is.na(y))
+ lowess(x[keep], y[keep], ...)
+ }
> with(car90, lines(mlowess(Price/1000, Weight, f = 0.5))
+ )
> fit <- rpart(Price ~ Mileage + Type + Country, cu.summary)
> par(xpd = TRUE)
> plot(fit, compress = TRUE)
> text(fit, use.n = TRUE)


0 Comments