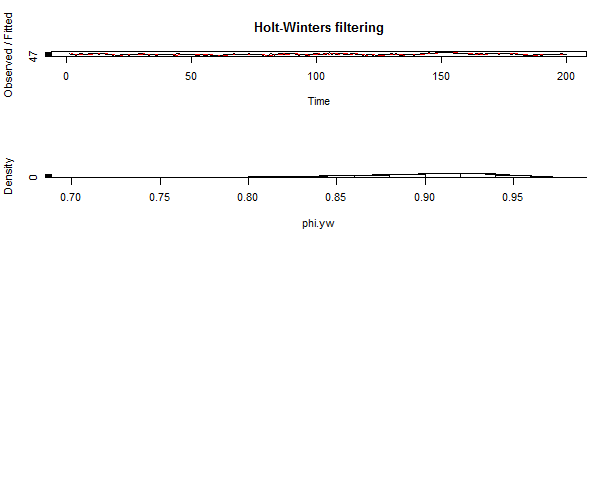
Estimating a Linear Trend x = arima.sim(list(order=c(2,0,0), ar=c(1,-.9)), n=2^8) > (u = polyroot(c(1,-1,.9))) [1] 0.5555556+0.8958064i 0.5555556-0.8958064i >…
Graph-R graph_attr(g4) named list() > plot(g4, edge.arrow.size=.5, vertex.label.color="black", vertex.label.dist=1.5, + vertex.color=c( "p…
CUSTOMER RESPONSE PREDICTION > str(iris) 'data.frame': 150 obs. of 5 variables: $ Sepal.Length: num 5.1 4.9 4.7 4.6 5 5.4 4.6 5 4.4 4.9 ... $ Sepa…
A model for analyzing trend such as seen in the global temperature data in is the random walk with drift model
Random Walk with Drift A model for analyzing trend such as seen in the global temperature data in is the random walk with drift model given by xt = δ + xt−1 + wt v…
Rmatrix > x=(1:20) > y=20:1 > z=c(1:20,19:1) > tmp <-c(4,6,3) > rep(tmp,10) [1] 4 6 3 4 6 3 4 6 3 4 6 3 4 6 3 4 6 3 4 6 3 4 6 3 4 6 3 4 6 …
Plot of Bivariate Standard Normal Distribution
Bivariate Standard Normal Distribution > x<-seq(-2,2,length=20) > > y<-x > bvn_function(x,y){ Error: unexpected '{' in "bvn_functi…
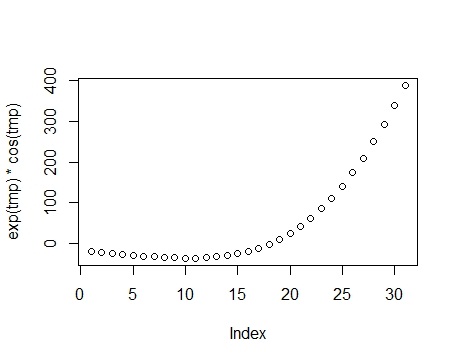
R functions work on bigger data R functions work on bigger data structures like vectors and matrices by default > x <- seq(0, 10, 0.1) > y <- sin(x) …
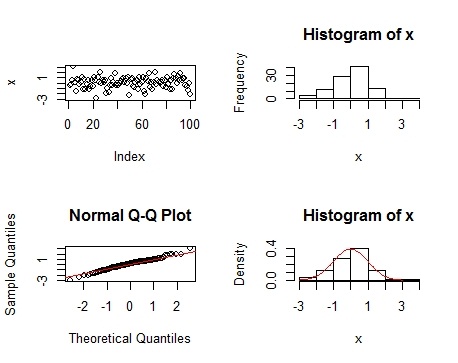
PLOT- R lines(density(x), col="blue") > xnew <- seq(min(x), max(x), length=100) > > lines(xnew, dnorm(xnew, mean(x), sd(x)), col="red&quo…
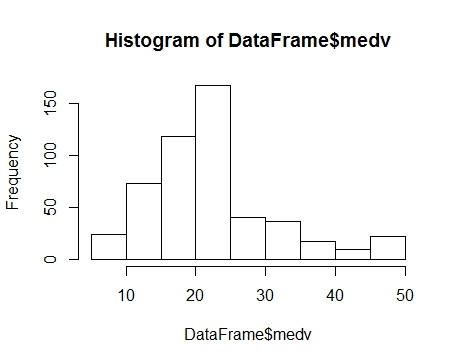
How to get Training of Neural Networks library(MASS) library(nnet) set.seed(123) DataFrame <- Boston help("Boston") View(DataFrame) str(DataFrame)…
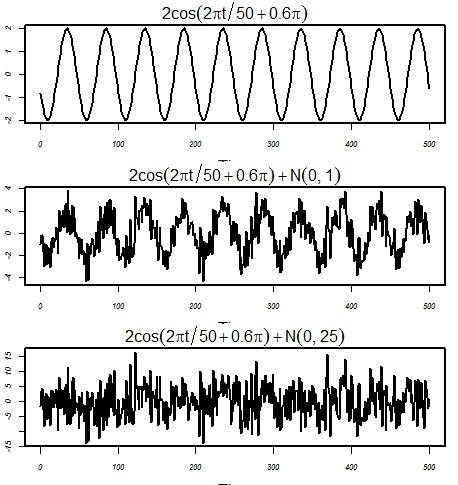
Cosine wave with period 50 points R
Cosine wave wave with period 50 points (top panel) compared with the cosine wave contaminated with additive white Gaussian noise, σw = 1 (middle panel) and σw = 5 (bo…
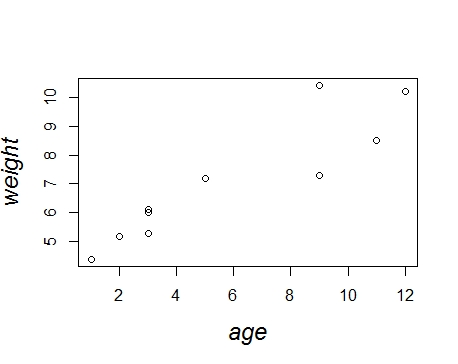
Data as vectors, using R the function c() > age <- c(1,3,5,2,11,9,3,9,12,3) > weight <- c(4.4,5.3,7.2,5.2,8.5,7.3,6.0,10.4,10.2,6.1) > age <- c(1,…
Time-series data analysis in R 2007-07-06 22.81021 2007-07-09 22.73409 2007-07-10 22.32310 2007-07-11 22.44488 2007-07-12 22.88631 200…
Shop Here
Popular Posts
About Me

- Manibhushan
- NEW DELHI, Delhi, India
- I am an educator to uses advanced tools and models. I use mathematics, science, statistics, economics, finance, econometrics, business mathematics, statistical analysis,AI,Data Science and Python or R language, computer science, stock analysis.
Featured Post
 seo tool
Free SEO Keyword research tool 2022
Your browser does not support iframes. Free SEO Keyword research tool 2022 Search …







Social Plugin